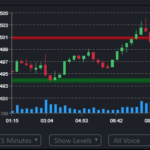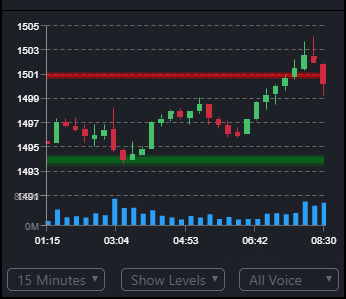


One of the most important tools for traders looking to maximize their performance is support and resistance level analysis. Support and resistance levels are mathematically constructed to detail to traders where price action will occur, by showing where prices of securities typically dip and reach maximums during a given period. Traders should be aware of the levels, as they should not open long positions around the resistance level, or sell short at the support.
In general, traders can buy these support and resistance levels from suppliers, or they can create levels themselves within their own trading platforms by directly marking charts. But, with the new added feature of the BetterTrader app, traders are able to have these levels automatically generated four times a day. This will allow traders to have real-time, up-to-date analysis on price movements so they can be best equipt to execute trades.

What are Dynamic support and resistance levels?
Dynamic support and resistance levels are incredibly important. The market is extremely volatile, so traders need to constantly be updated. Those using levels from the morning may fall behind the trading patterns come the afternoon, but with the BetterTrader capabilities, this will never be a problem. Moreover, traders do not need to worry about making the correct calculations for the levels, as they are already integrated within the app. This time-consuming process is directly eliminated by BetterTrader’s statistical analysis.
The Voice addition
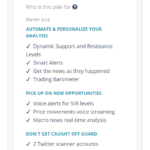
Since the markets are always moving, traders need to be updated as soon as the price of an instrument reaches a support or resistance level. BetterTrader is prepared for this by enabling the voice assistant to alert traders automatically when price touches a given level.
The Math behind the levels
For the more tech-savvy traders, the support-resistance levels are generated by algorithms that scan market data and cluster the market data points into groups. Then, in each group created, the algorithm scans the data points inside to find typical market levels. The idea behind the algorithm is to recognize where the market will tend not to be and typically bounces from. The market spends less time when it reaches that point – and this represents the generation in support and resistance levels.
Levels Timeframes
The algorithm runs on multiple time frames, so traders can get standard levels from the day, month, and year. The system is coded in python based on an analysis of candlestick patterns. Overall, this efficient system is best optimized to provide traders the tool they need to act on price movements and increase their profits.
These support-resistance levels are available within the BetterTrader app – Click here to get access